Helpful Pivot Tables and Charts for Prospect Development
Dear Diary,
I am thrilled to share this second installment of helpful Excel charts that visualize a fundraiser’s portfolio. Today, I want to look at two pivot tables and charts that I think you could adopt for your datasets. Please note that this is the most basic use of a pivot table, and it is meant to be entry level so all prospect development professionals can copy the charts.
To manage expectations or curb some enthusiasm, it is very important to be honest with yourself about your data. Despite having the desire to create something, your dataset may have some limitations. We all don’t have the most perfect data stored in our CRMs – for example, there may be duplicates and missing information – but we try to find workarounds. In this case, if you are not collecting philanthropic interests on prospects specifically in portfolios, maybe now is a good time to start entering that information into the system. Another example, if you don’t have certain tags (codes) for donors or alumni or patrons that allow you to easily pull reports on these groups, then maybe now is a good time to start entering this information.
For the charts below, we will be using the same dataset from the first Diary entry.

Chart One: I wanted to visualize where all the people in the portfolio are located by state.
Based on this table, our fundraiser mainly has prospects in portfolio based in California and Illinois. This seems like where their travels should be focused for the next few months.
Quick Tutorial: I already had my data on one sheet. (1) I turned it into a table by going to Insert > Table. I also made sure that the box was checked for headers. (2) I went to Insert > Table Design and gave it a name. (3) Click Insert > Pivot Table (Fill in the Table Name) > New Worksheet (4) You are now on a new worksheet utilizing your data. Drag your desired fields into Axis or Values.
When I look at the table, I have questions for the fundraiser during our next one-on-one meeting because (1) Should you have more prospects in the other states? (2) Should we increase your portfolio and are you comfortable with that? (3) Two out of the three in California are already donors, major donors.


Chart Two: I wanted to visualize philanthropic interests.

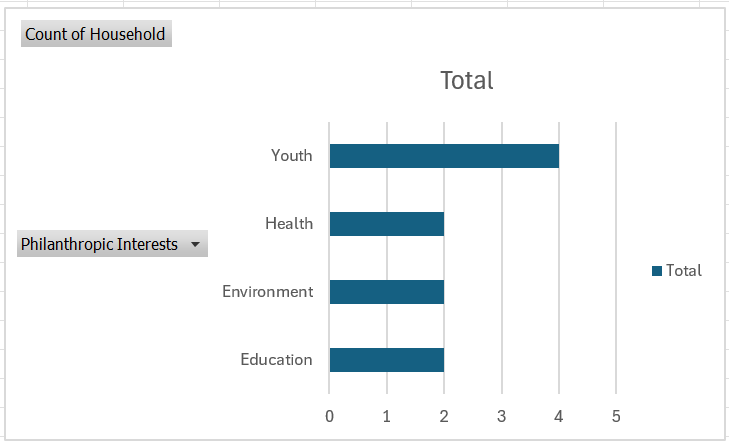
With most of their prospects interested in youth programs, it looks like the fundraiser now has a better sense of their portfolio for specific event invitations; meetings for specific stakeholders like the Director of Youth programs; and mass update emails. Aside from being more knowledgeable on the make-up of their portfolio, the chart and visual help the fundraiser be more organized and plan-ahead. This is also a great visual for fundraisers with focus areas, and it helps the prospect development professional make new portfolio assignments.
Bonus: Let’s talk metrics – It is January 1, Kay, Belinda, Ean, and Gina are all international fundraisers and here are their visits, calls, solicitations, and emails made during the last calendar year. Their senior director wants a recap of the year’s activities. Below in the comments section, let me know how you would best visualize this data.
Here is our dataset:

I added percentages – calculating how many of each activity was made divided by portfolio total.

Example - This shows me that in the previous year, Kay solicited 11.8 percent of her portfolio.
Then, I created a conditional table for the percentages:

Ean’s solicitations need to increase – 3.3 percent were solicited last year; But Ean emailed 88.9 percent of his portfolio. Ean is not shy and will email new people, so this is not an outreach issue, there is an issue with asking and ensuring prospects are primed for solicitations. I have to wonder how many people Ean has in cultivation.
Again, let me know how you would present this data to the senior director.
Until next time,
October 15th!